Completion requirements
Mapping data ecosystems
Key to ensuring data is FAIR and safeguarded are the people, policies and processes that support its use.
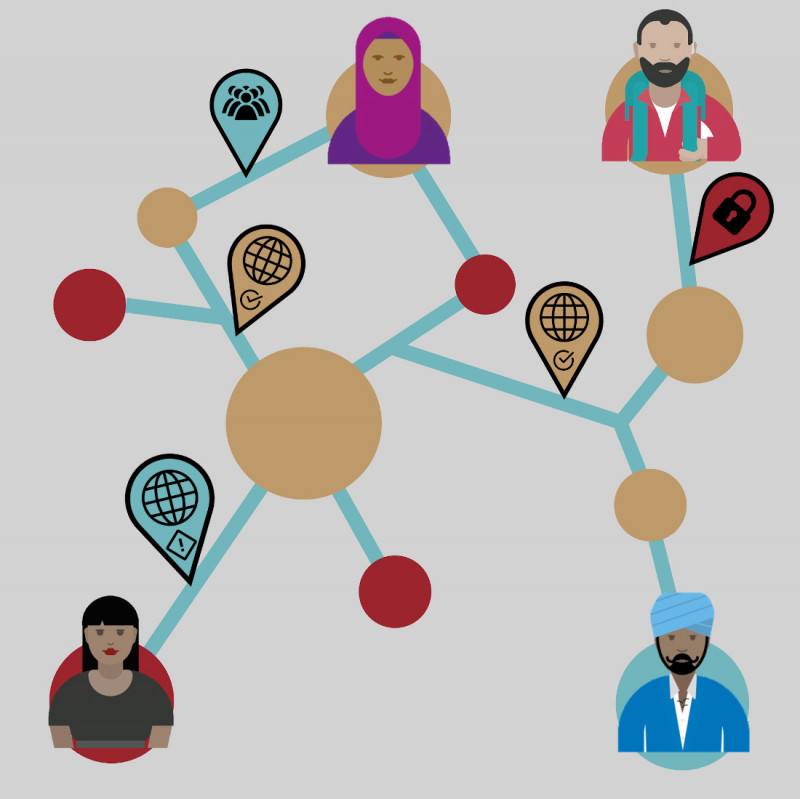
You can create a map - a visual representation - of a data ecosystem to help:
- identify the key people, the relationships between them and the different roles they play
- describe how data is being shared across The Data Spectrum
- show how data is being used to deliver a service
- show where data is not being shared
What tools are available?
You will find guides to help you understand personas in agricultural ecosystems in the FAIR data toolbox. You can use these in conjunction with this methodology for mapping data ecosystems.